How to Measure Marketing Campaign Performance Using Data
From impressions to incrementality, and the arithmetic traps in between
5 Minutes Read
From impressions to incrementality, and the arithmetic traps in between
Campaign reporting is the analytics task most likely to produce a confidently wrong number, because every input arrives pre-formatted as a metric. The platform hands you conversions, revenue, and a ROAS figure. Nothing about that output signals that the platform counted a conversion your other platform also counted, or that the ratio was computed over a window that excludes half the conversions the spend produced.
The measurement problem is not that these metrics are hard to calculate. It is that the easy calculation answers a different question from the one the business asked. "Did this campaign work" is a causal question. Attributed ROAS is a bookkeeping answer.
This article covers the metric stack and what each level can and cannot tell you, the arithmetic that makes campaign ratios go wrong in SQL, why attribution models disagree and what to do about it, the gap between attributed and incremental results, and how to compare campaigns fairly when they run at different spend levels.
The running example is one month of paid search and paid social for an ecommerce brand. Figures are illustrative and the currency is irrelevant to the arithmetic.
Before choosing metrics, write down the decision the measurement will feed. Different decisions require different measurement, and a single dashboard cannot serve all of them.
Three common decisions, and what each actually needs:
"Should we keep running this campaign?" needs incremental profit, not attributed revenue. "Which creative should we scale?" needs a comparison inside one channel where the audience and bidding are held roughly constant, and attribution differences largely cancel out. "How should we split next quarter's budget?" needs marginal returns at the spend levels being considered, which is a harder question than any of the platform reports answer.
Write down the target metric and the threshold before the campaign launches. A campaign evaluated against a metric chosen after the results are in will always look successful, because there is always one number that moved.
Campaign metrics form a stack. Each level is closer to the business outcome and further from what the platform can measure cleanly.
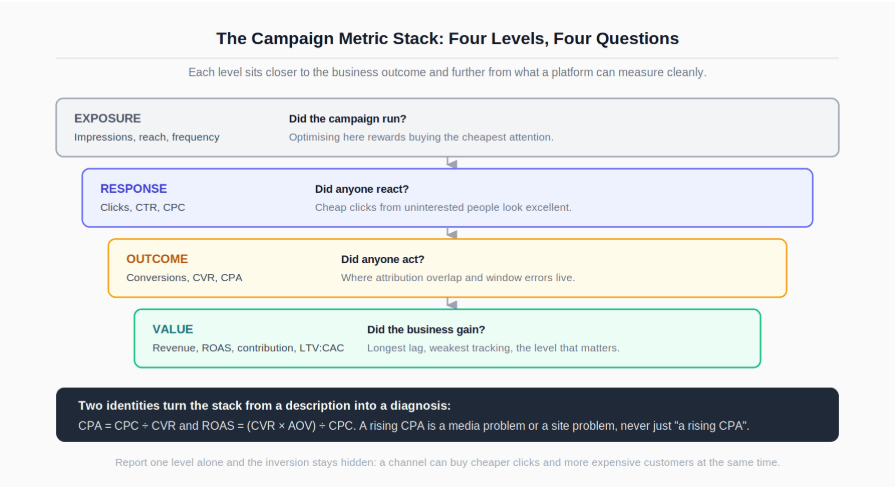
Exposure is impressions, reach, and frequency. It tells you the campaign ran. It cannot tell you it worked, and optimising for it rewards buying the cheapest possible attention.
Response is clicks, click-through rate, and cost per click. This is the first level where the audience does something, but a click is not a purchase and a channel that produces cheap clicks from uninterested people looks excellent here.
Outcome is conversions, conversion rate, and cost per acquisition. This is where most campaign reporting lives and where most attribution problems live too.
Value is revenue, return on ad spend, contribution margin, and the ratio of customer lifetime value to acquisition cost. This is the level the business cares about, and the level with the longest lag and the weakest tracking.
Here is the running example across the stack:
Metric | Paid search | Paid social |
|---|---|---|
Spend | 40,000 | 40,000 |
Clicks | 50,000 | 100,000 |
Cost per click | 0.80 | 0.40 |
Conversion rate | 2.0% | 0.8% |
Conversions | 1,000 | 800 |
Cost per acquisition | 40.00 | 50.00 |
Average order value | 100 | 90 |
Attributed revenue | 100,000 | 72,000 |
ROAS | 2.5 | 1.8 |
Social buys cheaper clicks and more expensive customers. That inversion is the whole reason the stack exists, and it is invisible if you report at only one level.
Two identities make the stack diagnostic rather than descriptive:
CPA  = CPC ÷ CVR
ROAS = (CVR × AOV) ÷ CPC
Check them against the table: search CPA is 0.80 ÷ 0.02 = 40, and search ROAS is (0.02 × 100) ÷ 0.80 = 2.5. The value of the decomposition is diagnostic ownership. A rising CPA is either a rising CPC or a falling conversion rate. The first is an auction and targeting problem owned by the media team; the second is a landing page, offer, or audience-quality problem owned by the site and product teams. Reporting CPA alone starts an argument about whose fault it is. Reporting the decomposition ends it.
The conversion rate term in that identity is itself a funnel, and a campaign that sends traffic to a page which converts poorly is a site problem wearing a marketing costume. Diagnosing which step loses the traffic is covered in the guide to finding where customers drop off in a funnel, and the general definition of the conversion funnel is a reasonable reference for the stage model these metrics sit on.
Campaign ratios have a specific failure mode that produces plausible numbers, and it appears in almost every hand-built campaign report.
A ratio of sums is not the average of ratios. Computing CPA as the mean of daily CPAs weights every day equally regardless of how much was spent on it.
Two days of spend:
Day | Spend | Conversions | Daily CPA |
|---|---|---|---|
Monday | 1,000 | 50 | 20.00 |
Tuesday | 9,000 | 150 | 60.00 |
Total | 10,000 | 200 | 50.00 |
The average of the two daily CPAs is 40. The actual CPA for the period is 50. The gap is not rounding: the mean treats a day with a tenth of the spend as equally important. Every ratio metric behaves this way, and the error compounds when spend is uneven across days, which it always is.
-- Correct: divide the summed numerator by the summed denominator.
SELECT
    campaign_id,
    sum(spend)                                        AS spend,
    sum(conversions)                                  AS conversions,
    sum(spend) / NULLIF(sum(conversions), 0)          AS cpa,
    sum(revenue) / NULLIF(sum(spend), 0)              AS roas
FROM campaign_daily
WHERE stat_date >= DATE '2026-08-01'
  AND stat_date <  DATE '2026-09-01'
GROUP BY campaign_id
ORDER BY spend DESC;

-- Wrong, and it will not raise an error:
--   avg(spend / conversions) AS cpa
Two details in that query earn their place. NULLIF guards against division by zero on days or campaigns with no conversions, which is common in low-volume segments and otherwise fails the whole query. And the aggregation is a sum of each component before the division, which is the behaviour documented alongside the other aggregates in the PostgreSQL aggregate function reference.
The same rule governs roll-ups. A weekly CPA is not the average of seven daily CPAs, and a total CPA across channels is not the average of channel CPAs. Store spend and conversions, derive the ratio at read time, and never store a ratio you will later need to aggregate. The broader query patterns behind campaign tables sit in the essential SQL skills and query guide for data analysts.
Attribution is the rule that assigns credit for a conversion to touchpoints that preceded it. It is a convention, not a measurement, and different conventions produce different answers from identical data.
Model | Credit rule | Systematically favours |
|---|---|---|
Last click | All credit to the final touch | Bottom-funnel channels, brand search, retargeting |
First click | All credit to the initial touch | Top-funnel channels, display, prospecting social |
Linear | Split evenly across touches | Channels appearing in long journeys |
Time decay | More credit to touches nearer the conversion | Recent and bottom-funnel activity |
Position based | Weighted to first and last | Discovery and closing, undercounts the middle |
Three practical consequences.
Platform-reported conversions double count across platforms. Each platform sees the touchpoints it delivered and claims the conversions that followed. Add the numbers up and the total exceeds the orders your warehouse recorded. In the running example, search claims 1,000 and social claims 800, but if the business recorded 1,550 paid orders that month, roughly 250 conversions are being claimed twice. Always reconcile the sum of platform-reported conversions against the order count in your own system, and report the reconciled figure.
The attribution window is part of the metric definition. A 7-day click window and a 30-day window produce materially different conversion counts for the same campaign, particularly for considered purchases. Two campaigns compared under different windows are not comparable at all, and window settings change without announcement when someone edits a platform configuration.
Choose one model as the reporting standard and hold it. Switching models mid-quarter changes every historical number and destroys the ability to compare. The useful practice is to publish under one model, keep a second model available as a sensitivity check, and treat a large gap between the two as a signal about journey length rather than as a number to average.
A conversion that happens on the ninth of the month may have been driven by a click on the second. Attaching both to their own dates and dividing produces a ratio that describes nothing.
There are two legitimate conventions and one wrong one.
Attributing conversions to the click date (the "cohort" view) aligns spend and outcome, so the CPA for a given day is the cost of the conversions that day's spend actually produced. It is the correct basis for evaluating efficiency, and its cost is that recent days remain incomplete as conversions continue landing.
Attributing conversions to the conversion date (the "reporting" view) matches revenue recognition and settles immediately. It is correct for reporting what happened, and wrong for judging what a given day's spend achieved.
Mixing them, which happens by default when spend comes from one table by stat_date and conversions come from another by order_date, produces a ratio with a numerator and denominator from different populations.
-- Cohort view: conversions attributed back to the click that drove them.
-- PostgreSQL interval syntax; BigQuery uses DATE_DIFF / TIMESTAMP_DIFF.
WITH attributed AS (
    SELECT
        c.campaign_id,
        c.click_date,
        o.order_id,
        o.order_total
    FROM clicks c
    JOIN orders o
      ON o.customer_id = c.customer_id
     AND o.order_ts >= c.click_ts
     AND o.order_ts <  c.click_ts + INTERVAL '7 days'   -- window is part of the definition
)
SELECT
    s.campaign_id,
    s.stat_date,
    s.spend,
    count(a.order_id)                              AS conversions,
    s.spend / NULLIF(count(a.order_id), 0)         AS cpa_cohort
FROM campaign_daily s
LEFT JOIN attributed a
       ON a.campaign_id = s.campaign_id
      AND a.click_date  = s.stat_date
GROUP BY s.campaign_id, s.stat_date, s.spend
ORDER BY s.stat_date;
Because the cohort view keeps maturing, exclude the most recent days from any comparison until the window has closed. A trailing window applied consistently across periods is the standard handling, and window functions are the natural tool for computing those rolling aggregates, as set out in the PostgreSQL window functions documentation.
Attribution tells you which touchpoint preceded a conversion. It cannot tell you whether the conversion would have happened anyway.
This is the largest gap in campaign measurement and the one most often glossed over. A retargeting ad shown to someone who already had the item in their cart will be credited with the sale under last click. A brand search ad captures people typing your company name, many of whom would have clicked the organic result at no cost. Both channels report excellent ROAS, and part of that reported performance is not caused by the spend at all.
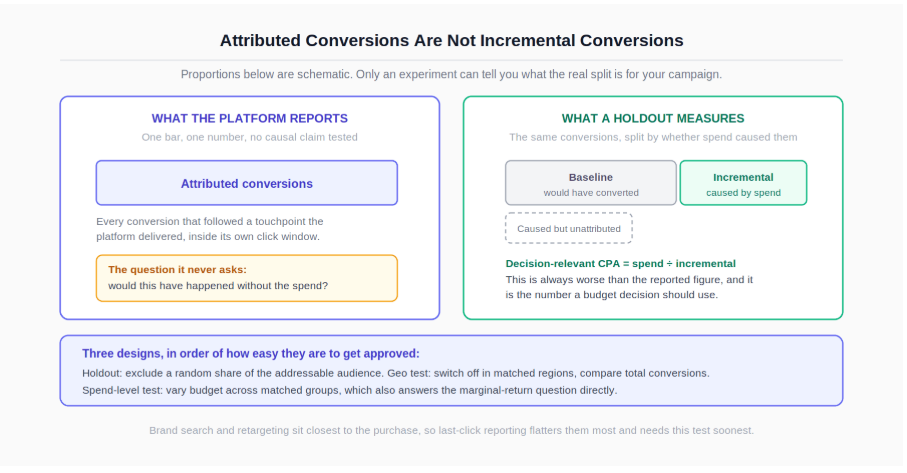
The only reliable way to separate them is an experiment, and the practical designs are cheaper than most teams assume.
Holdout. Withhold the campaign from a random share of the addressable audience and compare conversion rates. This is the cleanest design where the platform supports audience-level exclusion.
Geo test. Turn the campaign off in a set of regions matched to a set where it stays on, and compare the difference in total conversions rather than attributed ones. This works when audience-level randomisation is not available, and it depends on the regions being comparable.
Spend-level test. Vary budget across matched groups rather than switching it off entirely, which is easier to get approved and answers the marginal-return question directly.
Report incrementality as a ratio to attributed performance so the two are never confused. If a holdout implies that a share of attributed conversions would have happened regardless, then the decision-relevant CPA is the spend divided by the incremental conversions, which is always worse than the reported figure. That number is often unwelcome, and presenting it well is the same skill as presenting difficult findings to senior leaders: lead with the number, state the design that produced it, and name the assumption that would have to break for the reported figure to be right.
Two campaigns with different CPAs are not automatically better and worse. Four adjustments usually have to be made before the comparison means anything.
Adjust for spend level. Marketing returns diminish as spend rises, because the cheapest, most responsive audience is reached first. A campaign at a small budget and one at a large budget will show different CPAs even if they are identically effective, so comparing average CPA across very different spend levels is not a like-for-like test. The budget question depends on marginal CPA, the cost of the next conversion, not the average across everything spent so far.
Adjust for funnel position. A prospecting campaign and a retargeting campaign are measured on the same metric while doing different jobs, and the retargeting campaign will always win on last-click CPA because it is closer to the purchase by design.
Adjust for customer quality. A channel with a low CPA that acquires customers who never return is more expensive than a channel with a higher CPA that acquires repeat buyers. Where you have the history, compare on contribution over a fixed post-acquisition window rather than on first-order revenue alone.
Check the counts before believing the difference. Conversion counts at the campaign or creative level are frequently small, and small counts move a great deal on chance alone. Before declaring one creative the winner, look at how much the metric varies week to week within a single unchanged campaign; that variation is the noise floor the difference has to clear. The NIST/SEMATECH e-Handbook of Statistical Methods is a reliable reference for how that variability is characterised.
Three things belong on every campaign report, and their absence is what turns a measurement into an argument.
The definitions. Attribution model, click window, whether conversions are attributed to click date or conversion date, and whether the conversion figure is platform-reported or reconciled against your own orders. Two people comparing campaigns under different settings will disagree indefinitely without ever discovering why.
The decomposition, not just the headline. Give CPC and conversion rate alongside CPA, so the reader can see which component moved. A single ratio invites the wrong follow-up question.
The uncertainty and the exclusions. Which days are still maturing, which conversions were double claimed and removed, and how much of the attributed result an incrementality test would need to confirm. Publishing a clean point estimate over a measurement this noisy is how a campaign report becomes a commitment nobody can meet.
Present channel comparisons on a shared scale with the components visible rather than as a league table of ROAS, since a ranked list encourages cutting the channel at the bottom without asking what it was doing for the ones above it. The relevant encoding choices are covered in the guide to data visualisation for analysts.
For the query patterns underneath campaign reporting, including safe division, roll-ups, and joins between spend and conversion tables, the essential SQL skills and query guide for data analysts covers the foundations.
For the conversion rate term in the CPA identity, which is a funnel problem rather than a media problem, see finding where customers drop off in a funnel.
For presenting channel comparisons so that components stay visible instead of collapsing into a ranking, the data visualisation guide is directly applicable.
And for the organisational reasons campaign measurement so often fails to change a budget decision, the patterns in why analytics projects fail are worth reading alongside this.
Quiz
Question 1 of 15
FAQ